Export
Overview
This chapter explains how to export data from Woo into formats readable by other programs.
Plots
Plots as graphics
Plots can be exported as graphics into any format supported by Matplotlib (PDF, SVG, PNG, …) by clicking the save icon in the plot itself:
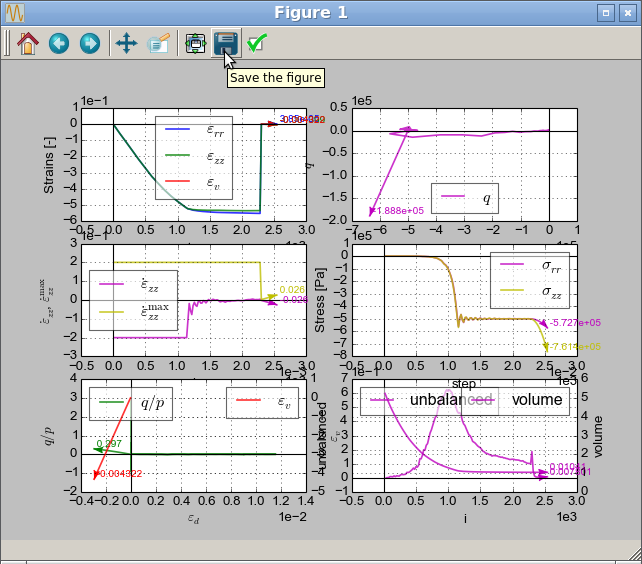
Plot data
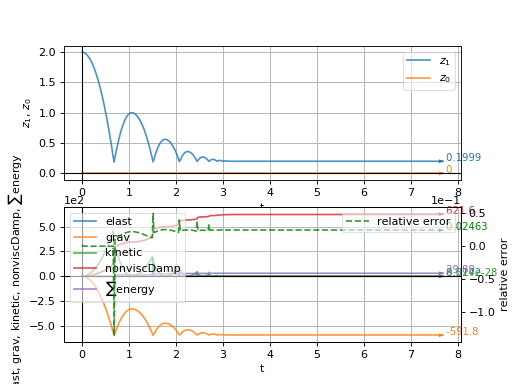
Plot data are stored in the S.plot.data dictionary; we can re-use the simulation of sphere and energy tracking which was giving the following plot:
(Source code, png, hires.png, pdf)

Plot data can be exported into text file:
Woo[1]: # from past.builtins import execfile

Woo[2]: # execfile('tutorial/data-plot-energy.py')

Woo[3]: # S.run(2000,True)

Woo[4]: # S.plot.saveDataTxt('tutorial/data-plot-energy.txt')
The saved file can be imported into any spreadsheet program; it looks like this (only the beginning is shown):
# $\sum$energy	$z_0$	$z_1$	elast	grav	kinetic	nonviscDamp	relative error	t
0.0	0.0	2.0	nan	0.0	0.0	nan	0.0	0.0
0.0008358947705644215	0.0	1.9986014863999995	nan	-0.37615264675400845	0.3017580121737712	0.07523052935080168	0.0011098779134294675	0.018
0.0008358947705644493	0.0	1.9946602208	nan	-1.5882000640724803	1.2713959460285487	0.31764001281449605	0.0002630886608787117	0.036000000000000004
0.0008358947705626729	0.0	1.9881762031999997	nan	-3.6361422519554147	2.9097496963348943	0.7272284503910831	0.00011492931846889536	0.054000000000000034
0.0008358947705595643	0.0	1.9791494336	nan	-6.519979210402813	5.21681926309281	1.3039958420805624	6.40984552268534e-05	0.07200000000000002
0.0008358947705597863	0.0	1.967579912	nan	-10.23971093941467	8.192604646302295	2.0479421878829345	4.081466062586856e-05	0.08999999999999998
0.0008358947705540132	0.0	1.9534676383999998	nan	-14.795337438990991	11.837105845963347	2.9590674877981984	2.8247789610109864e-05	0.10799999999999994
0.0008358947705504605	0.0	1.9368126128	nan	-20.186858709131773	16.150322862075967	4.037371741826356	2.070350510306721e-05	0.12599999999999992
0.0008358947705717767	0.0	1.9176148351999995	nan	-26.414274749837023	21.13225569464019	5.282854949967406	1.5822534453707214e-05	0.14399999999999988
0.0008358947706064157	0.0	1.8958743056	nan	-33.47758556110674	26.782904343656	6.695517112221349	1.2484238649332573e-05	0.16199999999999984
0.0008358947706437192	0.0	1.8715910239999995	nan	-41.37679114294093	33.10226880912339	8.275358228588187	1.0100908072593355e-05	0.1799999999999998
0.0008358947706952335	0.0	1.8447649903999999	nan	-50.111891495339584	40.09034909104236	10.022378299067917	8.340214011196253e-06	0.19799999999999976
0.0008358947707449715	0.0	1.8153962047999996	nan	-59.6828866183027	47.747145189412905	11.936577323660543	7.00275208308026e-06	0.21599999999999972
0.000835894770801815	0.0	1.7834846671999995	nan	-70.0897765118303	56.072657104235034	14.017955302366062	5.9629936630309115e-06	0.23399999999999968
0.0008358947708693165	0.0	1.7490303775999996	nan	-81.33256117592235	65.06688483550874	16.266512235184475	5.138719741238226e-06	0.25199999999999967
0.0008358947708302367	0.0	1.712033335999999	nan	-93.41124061057887	74.72982838323392	18.68224812211578	4.474252913042664e-06	0.2699999999999999
0.0008358947707378661	0.0	1.6724935423999994	nan	-106.32581481579984	85.06148774741061	21.265162963159973	3.9308021596119665e-06	0.28800000000000014
0.000835894770627732	0.0	1.6304109967999987	nan	-120.0762837915853	96.06186292803886	24.01525675831706	3.48067009887083e-06	0.3060000000000004
0.0008358947705247033	0.0	1.5857856991999992	nan	-134.6626475379352	107.73095392511867	26.93252950758704	3.103652688701876e-06	0.3240000000000006
There is an export function which, besides data file, also exports file for Gnuplot, an old-fashioned plotting program:
Woo[5]: S.plot.saveGnuplot('tutorial/data-plot-energy-gnuplot',timeStamp=False)  # no timeStamp=False so that the file does not change at every run
---------------------------------------------------------------------------
RuntimeError                              Traceback (most recent call last)
<ipython-input-5-4716ee2ac3be> in <module>
----> 1 S.plot.saveGnuplot('tutorial/data-plot-energy-gnuplot',timeStamp=False)  # no timeStamp=False so that the file does not change at every run

~/.local/lib/python3.8/site-packages/woo/plot.py in Scene_plot_saveGnuplot(P, baseName, term, extension, timestamp, comment, title, varData, timeStamp)
    870     """
    871     data,imgData,plots,labels,xylabels=P.data,P.imgData,P.plots,P.labels,P.xylabels
--> 872     if len(list(data.keys()))==0: raise RuntimeError("No data for plotting were saved.")
    873     if timestamp: baseName+=_mkTimestamp()
    874     baseNameNoPath=baseName.split('/')[-1]

RuntimeError: No data for plotting were saved.
#!/usr/bin/env gnuplot
#
set term wxt 0 persist
set xlabel 't=S.time'
set grid
set datafile missing 'nan'
set ylabel '$z_1$,$z_0$'
plot  "< bzcat data-plot-energy-gnuplot.data.bz2" using 9:3 title '← $z_1$(t)' with lines, "< bzcat data-plot-energy-gnuplot.data.bz2" using 9:2 title '← $z_0$(t)' with lines
set term wxt 1 persist
set xlabel ' t=S.time'
set grid
set datafile missing 'nan'
set ylabel 'elast,grav,kinetic,nonviscDamp,$\sum$energy'
set y2label 'relative error'
set y2tics
plot  "< bzcat data-plot-energy-gnuplot.data.bz2" using 9:4 title '← elast(t)' with lines, "< bzcat data-plot-energy-gnuplot.data.bz2" using 9:5 title '← grav(t)' with lines, "< bzcat data-plot-energy-gnuplot.data.bz2" using 9:6 title '← kinetic(t)' with lines, "< bzcat data-plot-energy-gnuplot.data.bz2" using 9:7 title '← nonviscDamp(t)' with lines, "< bzcat data-plot-energy-gnuplot.data.bz2" using 9:1 title '← $\sum$energy(t)' with lines, "< bzcat data-plot-energy-gnuplot.data.bz2" using 9:8 title 'relative error(t) →' with lines axes x1y2
Those figures don’t interpret math and look a bit rough, but may be useful for people used to these tools:


Packings
Packings contain purely geometrical information about particles, without material properties, velocity or anything else.
SpherePack
woo.pack.SpherePack is sphere-only, as this feature allows many operations to be optimized, as only position and radius is stored for each particles. SpherePack can be saved and loaded from/to file in CSV (space-separated) file. It is occasionally useful to do analyses on e.g. radii distribution of particles in 3rd-party tools, and this might be a useful format for interchange.
Format of the CSV file is the followin:
x y z r(center coordinates and radius), one sphere per line, as ASCII float numbers;clumps are supported, by adding an extra column with clump number (to all lines); spheres with the same clump number will be clumped together when added to the simulation. In mixed packings (clumps, non-clumps), stand-alone spheres can be given
-1as clump number;lines starting with
#are comments and are ignored, with some exceptions:##PERIODIC:: x y zline encodes periodic cell size of the packing (cellSize);##USER-DATA:: datacontains arbitrary data (no newlines allowed) which will be saved and loaded with the packing.
Woo[6]: sp=woo.pack.SpherePack()   # create a new object

Woo[7]: sp.fromDem(S, S.dem)        # extract all spheres in this scene

Woo[8]: sp.saveTxt('export-spherepack.txt')
The saved file can looks e.g. like this:
7.71021 10.6062 5.91934 0.217513
5.85643 8.52155 5.99748 0.282825
11.7969 13.99 5.69994 0.388675
7.26407 12.7107 5.51751 0.507575
8.78343 6.70809 5.16655 0.354871
6.63237 9.70458 6.42316 0.223495
9.01273 10.2351 4.69186 0.327873
6.82611 11.182 5.34845 0.213343
8.57821 6.50656 9.28098 0.474686
Such file can be loaded into Woo again (see toSimulation):
Woo[9]: sp=woo.pack.SpherePack()

Woo[10]: sp.loadTxt('export-spherepack.txt')

Woo[11]: sp.toSimulation(S) # using default material
Out[11]: [1]
ShapePack
woo.dem.ShapePack can contain any particles which support it (boundary particles are skipped) as it stores variable number of data for each particle.
Woo[12]: sp=woo.dem.ShapePack()     # create new object

Woo[13]: sp.fromDem(S, S.dem)       # get data from the current simulation

Woo[14]: sp.saveTxt('export-shapepack.txt')
The resulting file is a bit more complicated:
0 Capsule 0.0120227 0.976311 0.163282 0.105552 -0.0138765 -0.0322094 -0.0335685
1 Capsule 0.849475 0.849563 0.0607862 0.0953496 0.0315324 0.0102243 0.000629567
2 Capsule -0.372623 -0.103693 0.0763046 0.141139 0.0639594 0.00390455 0.000197987
3 Capsule 0.884581 0.32526 0.0991963 0.17232 0.0543704 0.0431827 -0.00213683
4 Capsule 0.610379 0.250056 0.257899 0.117386 0.0160657 -0.0521275 0.012216
5 Capsule -1.07945 -0.0630431 0.0648866 0.122897 -0.0513651 0.0231532 -0.000282427
6 Capsule 0.629565 1.33939 0.202427 0.099201 0.0177916 0.0208184 -0.0254291
7 Capsule -0.115262 -1.0465 0.089268 0.170938 0.0703223 0.0447295 0.00343105
8 Capsule -0.331438 0.762446 0.121542 0.114695 0.0252811 -0.0259674 -0.020808
9 Capsule 0.383944 0.935563 0.397593 0.154123 0.0513785 0.0153721 -0.00217204
10 Sphere -0.192145 0.137062 0.592456 0.0682023
10 Sphere -0.186653 0.215515 0.615108 0.109124
10 Sphere -0.181162 0.293969 0.63776 0.0682023
11 Sphere 0.23314 -0.535194 0.543624 0.0788098
11 Sphere 0.146563 -0.499811 0.529616 0.126096
11 Sphere 0.0599855 -0.464427 0.515607 0.0788098
12 Sphere -0.355005 0.980683 0.353488 0.110661
12 Sphere -0.345734 0.89573 0.392399 0.110661
13 Sphere -0.751995 0.926802 0.246687 0.101449
13 Sphere -0.828549 0.924203 0.207408 0.101449
14 Sphere -0.700782 -0.661376 0.236885 0.0769197
15 Sphere -0.671113 -0.742401 0.269667 0.123072
16 Sphere -0.641443 -0.823426 0.30245 0.0769197
17 Sphere 0.0668563 0.138768 0.724237 0.120268
18 Sphere 0.167893 0.12529 0.729157 0.120268
3d view
Settings and manupulation of the 3d view are covered in 3d rendering.
Images
Snapshots from the 3d view can be created by pressing Control-C in the view. THe bitmap will be copied to the clipboard and can be pasted into documents or image editors.
Movies
Sequence of snapshots can be saved periodically by checking ; periodicity should be set according to your needs, and perhaps some experimentation is necessary as to how often to take a snapshot. When done, click on . The resulting .mpeg4 file can be, for example, uploaded to youtube.
This (almost) the same simulation in Paraview: